Index of /economics, markets/Cool stuff
- Parent Directory
- 0_Cool stuff notes.link.txt
- 0_Cool stuff other.link.txt
- Fed Citi Corp: Federal Reserve balance sheet grows again, 230317.png
- Fed Dent - SP500 global vs QE [Fed, ECB, BOJ] 2008-2020, 201124.jpeg
- GDP Deutsch Bank, Bloomberg Finance US Treasury yields are rising in spite, not because, of global growth, 230929.jpeg
- GDP Deutsch Bank, Haver Analytics With Fed QT continuing, it could be difficult to get supply-demand technicals in balance, 230929.jpeg
- GDP UBS: Economic expansions have grown longer.png
- PE Dent: US CAPE Ratio Most Overvalued vs. Any Stock Market in the World.png
- PE Hulbert: Shiller CAPE is best PE ratio 231023.png
- Treas UBS Group: Fiscal contraction stopped last summer, 230721.png
- bond UBS Group: High-yield bond issuance market has re-opened,230721.png
- business Florida, Hathaway 05Oct2018 Rise of the global startup city.pdf
- com $CDN vs Commodities 1996-2008, 141123.jpg
- com CdnGrainComm: Global export & destination, 190815.png
- com CdnGrainCommission: Canada Farm exports, 190815.png
- com Prechter 270 years commodities linear index 210907.png
- com Prechter 90 years commodities log index 210907.png
- com Puetz & Borchardt 2011 p539 Babylon crop prices.jpg
- com Uranium Energy Corp - global cost curve, 210908.png
- crash Dent S&P500 top and crash scenario likely into late 2023 - 5-wave pattern, 220601.png
- crash Dent velocity of money crashes since stock and real estate bubbles began, 220921.png
- crash John Hussman: Four Stock Indicators Flash Crash as in 2000, 2007, 1972. More to Come.png
- crash Puetz - financial crashes since 1310 & 88 year Gleissberg cycle, 190223.png
- crash Puetz: stock market crashes [03Sep1929 DJIA, 27Jan1980 Gold, 24Aug1987 DJIA, 27Dec1989 Japan Nikkei, 07Sep2021], 211010.png
- cur $CDN-$US exchange rate vs commodity prices 2003-2013, 141123.jpg
- cycle Akhil Patel: roadmap to the 18.6 year cycle.png
- cycle Dent: 500-year mega innovation cycle, 180822.jpg
- cycle Dent: Most stkIdx tops explained by [tech-innov 45y, generation 39y, decenniel 10y] cycles.png
- debt Dent Total debt vs GDP US 1870-2012, 180824.jpg
- debt Dent Total debt vs GDP Western nations 2013, 180824.jpg
- debt Dent Zombie companies cant pay debt service - tripled to 24% since 2017, 220601.png
- debt Dent: Total debt vs GDP US 1870-2012, 180822.jpg
- debt Dent: Total debt vs GDP Western nations 2013, 180822.jpg
- debt Dent: US household debt not as high as other countries, 230731.png
- debt Fitch: Serious delinquency of non-agency RMBS loans, 1802dd.png
- debt Household debt-to-income Canada vs US 1990-2013.png
- debt Household leverage US vs Canada.PNG
- debt Puetz: ratio of personal non-financial debt to disposable income, 190526.jpg
- debt UBS Group: Household debt loads appear manageable, 230721.png
- debt vs income Canada-US 1990-2012.png
- div Dent: SP500 present value of dividends, foreshadows major crash.png
- earn Deutsche Bank via MktWatch SP500 Q3 2022 consensus earnings, 221019.png
- earn Goldman Sachs: SP500 EPS bottom-up consensus estimates, 230409.jpeg
- earn MktWatch, Morgan Stanley- 1 year leading US earnings model, 220905.jpeg
- earn Morgan Stanley, MktWatch - 1 year leading US earnings model, 220905.jpeg
- farm Financial Post net-farm-income-newsletter, 190815.png
- farm net income Canada, Financial Post 190815.png
- gas US EnergyInfAdmin: Working gas in underground storage compared with 5-year maximum and minimum, 230721.png
- gold IvanLabrie: Gold long term trend & historical comparison, 220928.png
- gold gold price vs China reserves 1998-2012, 141123.jpg
- house Dent : Likely home-price peak near $452k, sharpest spike ever since covid, 220601.png
- house Dent Contrary to perceptions, new home sales have fallen rapidly sinceAug2020, 220601.png
- house Dent Normal-valuation housing markets increasingly rare, mostly in upper midWest, 220601.png
- house Dent after extreme lows in late 2020, housing months supply exploding back up, 220601.png
- house Dent: existing home sales 35% volume down 2010-2023.png
- house Dent: mortgage purchase index 1990-2023, worse than 2008.png
- house FedRes via Keith Jurow 02Apr2020 mortgage re-defaults 2015.png
- house Hulbert, Philadelphia Fed: Seven decades of no capital gains.png
- house Perry: Home prices US vs Canada 2010-2011, 141123.jpg
- house Puetz - mortgages, serious delinquency of non-agency RMBS loans.jpg
- house Swaminathan, UBS global real estate bubble index, 230925.png
- house price vs personal income US-Canada 1980-2010.jpg
- house prices US-Canada in $CDN 1999-2012.jpg
- inflat Howell, TradingView: SP500 inflation rate is like covid years, 14%-per-year, 230609.png
- inflatn Dent: US Inflation vs Quantitative Easing 2002-2020, 201124.jpeg
- inflatn Puetz & Borchardt 2011 p540 London consumer, Chinese rice rices.jpg
- invest Hulbert: 150+ years of conservative investing, winning by losing less, from Batussen, Vleir, May.png
- invest Hulbert: ETFs underperform same mutual funds.png
- invest Hulbert: More risk doesnt always lead to more return, 28May2022.png
- invest Hulbert: Single Greatest Predictor of Future Stock Market Returns, Philosophical Economics blog, 230327.jpeg
- invest MrRenev, TV: Comparing different investing time frames, 200910.png
- invest Puetz & Borchardt 2011 p541 USA personal financial index tests.jpg
- invest VasilyTrader best reversal price actions, 230414.png
- jobs Dent: US job openings versus SPX, 2001-2023.png
- labor Dent: Labor force participation rate vs inflation, 220111.png
- labor Dent: labor force growth vs inflation US 1953-2013, 180822.jpg
- labor Dent: labor force growth vs inflation US 1953-2013, 180824.jpg
- labor Zeihan 2016 Mexican boom - labour cheaper than China post-2008.png
- loan FedResDallas Bank lending has rolled over after SVB, 230406.png
- manuf UBS Group: Manufacturing has slowed much more than services, 230721.png
- money Dent, Reventure Consulting: M2 contracts 1st time since Great Depression, 1930-1932.png
- nino NOAA: El Nino global climate impacts [Dec-Feb, Jun-Aug]2024, 230714.png
- oil dow_gold_oil_crb1966-current,141123.png
- oil FinPost: Canada prodn costs, 160502.png
- oil Goldman Sachs Cost curve of GS oil top projects, 230929.jpeg
- oil IvanLabrie TW Oil long term trend & historical comparison, 28Sep2022.png
- oil Roogers- world fiscal systems for oil, 141123.png
- oil Zeihan: Full cycle breakeven oil prices (2012 average), 16mmdd.png
- oil dow_gold_oil_crb1900-current, 141123.png
- oil dow_gold_oil_crb1900current_rev, 141123.png
- oil price vs $Canadian 2006-2012.jpg
- oil price vs Rig Count world 1975-2010.jpg
- oil-price-versus-unemployment US 1970-2010.jpg
- pandemic Howell: SP500 uptrend parallel to covid period,230802.png
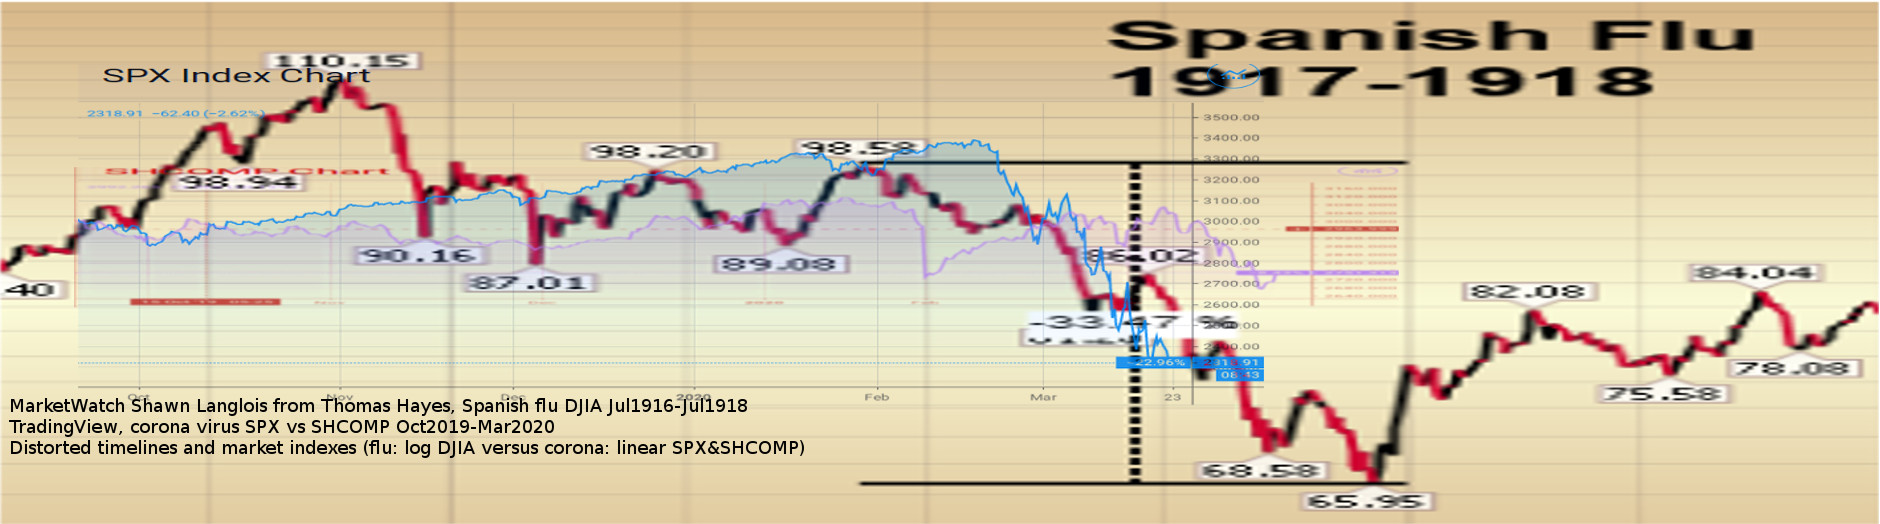
- pandemic MarketWatch 200320 Shawn Langlois from Thomas Hayes DJIA Spanish flu, TradingView SPX vs SHCOMP corona virus.jpg
- pandemic MarketWatch Cumulative COVID-19 cases for countries temperate vs tropics 17Mar2020.png
- popln Dent: China population from ~1.43G 2010 -> 0.8G 2100.png
- popln Dent: US births lagged for peak spending, 180822.png
- popln Dent: births lagged 46 years vs DOW Index US 1956-2056 v2, 180824.jpg
- productivity Dent: China productivity slowing, 4.5% 2008 -> 0.7% 2019.png
- rate Prechter 80 years interest rates 210907.png
- rate Puetz 10y Treasury minus 1y LIBOR 190516.jpg
- rate Puetz Germany 10y government bond yield 190516.jpg
- rate Puetz: Japan 10y government bond yield, 190516.jpg
- rate Puetz: USA 10y government bond yield, 190516.jpg
- recess Dent: Sahm Rule of Surging Unemployment Explains Fed Panic of 2020-2022.png
- recess Dhaval Joshi: most markets confirm a world recession, 230706.png
- recess Dhaval Joshi: world recession is sub-2 percent growth (past recessions), 230706.png
- recess FedRes: Fed rate-hiking cycles are often followed by a recession, 230723.png
- save UBS Group: Excess savings have supported the consumer, 230721.png
- sector Hulbert: What the sector relative strength ranking is saying, 230314.png
- social Dent unfunded entitlements US 2011, 180824.jpg
- social Dent: unfunded entitlements US 2011, 180822.jpg
- stkIdx Amjad Farooq: DJIA 1919-29 versus 2010-20, 200319.png
- stkIdx Dent: Shanghai comp 2005-23 projects ~3,200 -> 1,000.png
- stkIdx- US vs global equity relative price perfom.png
- stkidx Goldman Sachs [SPX, NDX, RUT] 1985-2019 index seasonality, 210921.png
- stkidx Hulbert - SP500 exponential semi-log trendline 1871-2022, 221029.png
- stkidx Hulbert SP500 exponential semi-log trendline 1871-2022, 29Oct2022.png
- stkidx Hulbert- trailing six months correlation between the total stock and total bond markets, 220107.png
- stkidx Michael Batnick DJIA 1919-2018 with post- crash recovery, 200319.png
- stkidx Prechter 212 years DJIA index 210907 cycles [20, 40] years.png
- stkidx Prechter 212 years DJIA index 210907.png
- stkidx Puetz & Borchardt 2011 p543 USA stock prices tests.jpg
- stkidx Puetz & Borchardt 2011 p544 USA stock prices half hour.jpg
- stkidx Puetz & Borchardt 2011 p545 USA stock prices tests.jpg
- tech Dent: Disruption and Overlapping S-Curves, Internet of past -> Blockchain future.png
- tech Dent: Evolution of computers in overlapping S-curves 1946-2022.png
- tech Dent: Tech Stocks Outperform S&P 500 Even More Than at 2000 and 1968 Tops.png
- vote Prechter 1999 Landslide elections & Stock Prices, 200313.jpg
- vote VincePrice TV: impact of presidential election on financial markets, 200920.png
- wage Johnson: US real average earning index 1964-2022, 231023.png
- z_Archive/
- z_history/
![Fed Dent - SP500 global vs QE [Fed, ECB, BOJ] 2008-2020, 201124.jpeg](Fed%20Dent%20-%20SP500%20global%20vs%20QE%20%5bFed,%20ECB,%20BOJ%5d%202008-2020,%20201124.jpeg)
![crash Puetz: stock market crashes [03Sep1929 DJIA, 27Jan1980 Gold, 24Aug1987 DJIA, 27Dec1989 Japan Nikkei, 07Sep2021], 211010.png](./crash%20Puetz:%20stock%20market%20crashes%20%5b03Sep1929%20DJIA,%2027Jan1980%20Gold,%2024Aug1987%20DJIA,%2027Dec1989%20Japan%20Nikkei,%2007Sep2021%5d,%20211010.png)
![cycle Dent: Most stkIdx tops explained by [tech-innov 45y, generation 39y, decenniel 10y] cycles.png](./cycle%20Dent:%20Most%20stkIdx%20tops%20explained%20by%20%5btech-innov%2045y,%20generation%2039y,%20decenniel%2010y%5d%20cycles.png)
![nino NOAA: El Nino global climate impacts [Dec-Feb, Jun-Aug]2024, 230714.png](./nino%20NOAA:%20El%20Nino%20global%20climate%20impacts%20%5bDec-Feb,%20Jun-Aug%5d2024,%20230714.png)
,%2016mmdd.png)
,%20230706.png)
![stkidx Goldman Sachs [SPX, NDX, RUT] 1985-2019 index seasonality, 210921.png](stkidx%20Goldman%20Sachs%20%5bSPX,%20NDX,%20RUT%5d%201985-2019%20index%20seasonality,%20210921.png)
![stkidx Prechter 212 years DJIA index 210907 cycles [20, 40] years.png](stkidx%20Prechter%20212%20years%20DJIA%20index%20210907%20cycles%20%5b20,%2040%5d%20years.png)