The Modern Temperature Trend
Tracking the world's average temperature from the late 19th century, people in the 1930s realized there had been a pronounced warming trend. During the 1960s, scientists found that over the past couple of decades the trend had shifted to cooling. Many scientists predicted a continued and prolonged cooling, perhaps a phase of a long natural cycle or perhaps caused by human activities. Others insisted that humanity's emission of gases would bring warming over the long run. In the late 1970s, this group's views became predominant. By the late 1980s, it was plain that the cooling spell, whose cause remained mysterious, had been a temporary distraction. For whatever reason, unprecedented global warming was underway.
"The subject... is a vast one, and only too easily submerged in an ocean of repelling statistics, unless firm measures are taken to reduce the mass of data into a form which eliminates distracting or irrelevant detail..." — G.S. Callendar(1) climate change, urban heat island, cities, Little Ice Age, Medieval Warm Period, satellites, upper atmosphere, hockey stick
| If you had a certain type of mind, temperature statistics could be more absorbing than a book of crossword puzzles. Ever since the invention of the thermometer, some amateur and professional scientists had recorded the temperature wherever they happened to be living or visiting. During the 19th century, government weather services began to record measurements more systematically. By the 1930s, observers had accumulated millions of numbers for temperatures at stations around the world. It was an endlessly challenging task to weed out the unreliable data, average the rest in clever combinations, and compare the results with other weather features such as droughts. Many of the players in this game pursued a hope of discovering cycles of weather that could lead to predictions. Perhaps, for example, one could correlate rainfall trends with the eleven-year sunspot cycle. | - LINKS -
More discussion in |
| Adding interest to the game was a suspicion that temperatures had generally increased since the late 19th century — at least in eastern North America and western Europe, the only parts of the world where reliable measurements went back so far.(2) In the 1930s, the press began to call attention to numerous anecdotes of above-normal temperatures. The head of the U.S. Weather Bureau's Division of Climate and Crop Weather responded in 1934. "With 'Grand-Dad' insisting that the winters were colder and the snows deeper when he was a lad," he said, "...it was decided to make a rather exhaustive study of the question." Averaging results from many stations in the eastern United States and some scattered locations elsewhere around the world, the weather services found that 'Grand-Dad' was right: average temperatures had risen several degrees Fahrenheit (°F) since 1865 in most regions. Experts thought this was simply one phase of a cycle of rising and falling temperatures that probably ambled along for centuries. As one scientist explained, when he spoke of the current "climate change" he did not mean any permanent shift, but a long-term cyclical change "like all other climate fluctuations."(3) |
|
| It may have been the press reports of warming that stimulated an English engineer, Guy Stewart Callendar, to take up climate study as an amateur enthusiast. He studied global temperature change systematically and thoroughly. A 19th-century German had made an attempt at this in seeking a connection with sunspot cycles. Otherwise, if anyone else had thought about it, they had probably been discouraged by the scattered and irregular character of the weather records, plus the common assumption that the average climate scarcely changed over the span of a century. After countless hours of sorting out data and penciling sums, Callendar announced that the temperature had definitely risen between 1890 and 1935, all around the world, by close to half a degree Celsius (0.5°C, equal to 0.9°F).(4) Callendar's statistics gave him confidence to push ahead with another and more audacious claim. Reviving an old theory that human emissions of carbon dioxide gas (CO2) from burning fuel could cause a "greenhouse effect," Callendar said this was the cause of the warming. (For the old theory, follow the link in the righthand column from the essay on Simple Models of Climate. For scientific views of Callendar's day on the theory, follow the link to the essay on The CO2 Greenhouse Effect.) |
|
| It all sounded dubious to most meteorologists. Temperature data were such a mess of random fluctuations that with enough manipulation you could derive all sorts of spurious trends. Taking a broader look, experts believed that climate was comfortably uniform. "There is no scientific reason to believe that our climate will change radically in the next few decades," the highly respected climatologist Helmut Landsberg explained in 1946. "Good and poor years will occur with approximately the same frequency as heretofore."(5) If during some decades there was an unmistakable climate change in some region, the change must be just part of some local cycle, and in due time the climate of the region would revert to its average. |
|
| (By the end of the 20th century, scientists were able to check Callendar's figures. They had done far more extensive and sophisticated analysis of the weather records, confirmed by "proxy" data such as studies of tree rings and measurements of old temperatures that lingered in deep boreholes. The data showed that the world had in fact been warming from the mid 19th century up to about 1940, mostly because of natural fluctuations. As it happened, most of the warming had been in the relatively small patch of the planet that contained the United States and Europe — and thus contained the great majority of scientists and of those who paid attention to scientists. But for this accident, it is not likely that people would have paid attention to the idea of global warming for another generation. That would have severely delayed our understanding of what we face.) |
|
| During the 1940s only a few people looked into the question of warming. A prominent example was the Swedish scientist Hans Ahlmann, who voiced concern about the strong warming seen in some northern regions since early in the century. But in 1952, he reported that northern temperatures had begun to fall again since around 1940.(6) The argument for warming caused by CO2 emissions, another eminent climatologist wrote in 1949, "has rather broken down in the last few years" when temperatures in some regions fell.(7) In any case (as yet another authority remarked), compared with the vast slow swings of ice ages, "the recent oscillations of climate have been relatively small."(8) | |
| If the North Atlantic region was no longer warming, through the 1940s and 1950s it remained balmy in comparison with earlier decades. People were beginning to doubt the assumption of climate stability. Several scientists published analyses of weather records that confirmed Callendar's finding of an overall rise since the 1880s.(9) An example was a careful study of U.S. Weather Bureau data by Landsberg, who was now the Bureau's chief climatologist. The results persuaded him to abandon his belief that the climate was unchanging. He found an undeniable and significant warming in the first half of the century, especially in more northern latitudes. He thought it might be due either to variations in the Sun's energy or to the rise of CO2.(10) Others pitched in with reports of effects plain enough to persuade attentive members of the public. Ahlmann for one announced that glaciers were retreating, crops were growing farther north, and the like.(11) Another striking example was a report that in the Arctic "the ice is thinner at the present than ever before in historic times," and before long we might even see an open polar sea.(12) Such high-latitude effects were exactly what simple models suggested would result from the greenhouse effect warming of increased CO2. |
=>Aerosols |
| "Our attitude to climatic 'normals' must clearly change," wrote the respected climate historian Hubert H. Lamb in 1959. Recent decades could not be called normal by any standard of the past, and he saw no reason to expect the next decades would be "normal" either. Actually, since the 1930s the temperatures in his own homeland, Britain, had been heading down, but Lamb would not speculate whether that was the start of a cyclical downtrend. It could be "merely another wobble" in one region. Lamb's main point, reinforced by his scholarly studies of weather reports clear back to medieval times, was that regional climate change could be serious and long-lasting.(13) Most meteorologists nevertheless stuck to their belief that the only changes to be expected were moderate swings in one part of the world or another, with a fairly prompt return to the long-term average. If there was almost a consensus that for the time being there was a world-wide tendency to warming, the agreement was fragile. |
|
| In January 1961, on a snowy and unusually cold day in New York City, J. Murray Mitchell, Jr. of the U.S. Weather Bureau's Office of Climatology told a meeting of meteorologists that the world's temperature was falling. Independently of Callendar, Mitchell had trudged through all the exacting calculations, working out average temperatures for most of the globe, and got plausible results. Global temperatures had indeed risen until about 1940, Mitchell said. But since then, temperatures had been falling. There was so much random variation from place to place and from year to year that the reversal to cooling had only now become visible.(14*) |
|
| Acknowledging that the increasing amount of CO2 in the atmosphere should give a tendency for warming, Mitchell tentatively suggested that the reversal might be partly caused by smoke from volcanic eruptions and perhaps cyclical changes in the Sun. But "such theories appear to be insufficient to account for the recent cooling," and he could only conclude that the downturn was "a curious enigma." He suspected the cooling might be part of a natural "rhythm," a cycle lasting 80 years or so.(15) The veteran science correspondent Walter Sullivan was at the meeting, and he reported in the New York Times (January 25 and 30, 1961) that after days of discussion the meteorologists generally agreed on the existence of the cooling trend, but could not agree on a cause for this or any other climate change. "Many schools of thought were represented... and, while the debate remained good-humored, there was energetic dueling with scientific facts." The confused state of climate science was a public embarrassment. |
|
| Through the 1960s and into the 1970s, the average global temperature remained relatively cool. Western Europe in particular suffered some of the coldest winters on record. (Studies in later decades found that a quasi-regular long-term weather cycle in the North Atlantic Ocean had moved into a phase in the 1960s that encouraged Arctic winds to move southward there.)(16) People will always give special attention to the weather that they see when they walk out their doors, and what they saw made them doubt that global warming was at hand. Experts who had come to suspect greenhouse warming now began to have doubts. Callendar found the turn worrisome, and contacted climate experts to discuss it.(17) Landsberg returned to his earlier view that the climate was probably showing only transient fluctuations, not a rising trend. While pollution and CO2 might be altering the climate in limited regions, he wrote, "on the global scale natural forces still prevail." He added, however, that "this should not lead to complacency" about the risk of global changes in the distant future.(18) |
|
| One source of confusion was increasingly debated. Weather watchers had long recognized that the central parts of cities were distinctly warmer than the surrounding countryside. In urban areas the absorption of solar energy by smog, black roads and roofs, along with direct outpouring of heat from furnaces and other energy sources, created an "urban heat island" effect. This was the most striking of all human modifications of local climates. It could be snowing in the suburbs while raining downtown.(19) Some people pushed ahead to suggest that as human civilization used ever more energy, in a century or so the direct output of heat could be great enough to disturb the entire global climate.(20) If so, that would not happen soon, and for the moment the main consequences were statistical. | |
| Some experts began to ask whether the warming reported for the decades before 1940 had been an illusion. Most temperature measurements came from built-up areas. As the cities grew, so did their local heating, which might have given a spurious impression of global warming.(21*) Callendar and others replied that they were well aware of urban effects, and took them fully into account in their calculations. Mitchell in particular agreed that population growth could explain the "record high" temperatures often reported in American cities — but it could not explain the warming of remote Arctic regions.(22*) Yet the statistical difficulties were so complex that the global warming up to 1940 remained in doubt. Some skeptics continued to argue that the warming was a mere illusion caused by urbanization. | |
| While neither scientists nor the public could be sure in the 1970s whether the world was warming or cooling, people were increasingly inclined to believe that global climate was on the move, and in no small way. The reassuring assumption of a stable "normal" climate was rarely heard now. In the early 1970s, a series of ruinous droughts and other exceptionally bad spells of weather in various parts of the world provoked warnings that world food stocks might run out. Fears increased that somehow humanity was at fault for the bad weather — if we were not causing global warming with greenhouse gases, then perhaps we were cooling the globe with our smoke and smog. Responding to public anxieties, in 1973 the Japan Meteorological Agency sent a questionnaire to meteorological services around the world. They found no consensus. Most agencies reported that they saw no clear climate trend, but several (including the Japanese themselves) noted a recent cooling in many regions. Many experts thought it likely that the world had entered a long-term cool spell.(23) |
|
| Public pressure was urging scientists to declare where the climate was going. But they could not do so without knowing what caused climate changes. Haze in the air from volcanoes might explain some cooling, but not as much as was observed. As for air pollution from human sources, most experts doubted we were putting out enough to affect global climate. A more acceptable explanation was a traditional one: the Earth was responding to long-term fluctuations in the Sun's output of energy.(24) |
|
| An alternative explanation was found in the "Milankovitch" cycles, tens of thousands of years long, that astronomers calculated for minor variations in the Earth's orbit. These variations brought cyclical changes in the amount of sunlight reaching a given latitude on Earth. In 1966, a leading climate expert analyzed the cycles and predicted that we were starting on the descent into a new ice age.(25) In the early 1970s, a variety of measurements pinned down the nature and timing of the cycles as actually reflected in past climate shifts. Projecting the cycles forward strengthened the prediction. A gradual cooling was astronomically scheduled over the next few thousand years.(26) Unless, that is, something intervened. |
|
| It scarcely mattered what the Milankovitch orbital changes might do, wrote Murray Mitchell in 1972, since "man's intervention... would if anything tend to prolong the present interglacial." Human industry would prevent an advance of the ice by blanketing the Earth with CO2. A panel of top experts convened by the National Academy of Sciences in 1975 tentatively agreed with Mitchell. True, in recent years the temperature had been dropping (perhaps as part of some unknown "longer-period climatic oscillation"). Nevertheless, they thought CO2 "could conceivably" bring half a degree of warming by the end of the century.(27) The outspoken geochemist and oceanographer Wallace Broecker went farther. He suspected that there was indeed a natural cycle responsible for the cooling in recent decades, perhaps originating in cyclical changes on the Sun. If so, it was only temporarily canceling the greenhouse warming. Within a few decades that would climb past any natural cycle. "Are we on the brink of a pronounced global warming?" he asked.(28*) |
|
| Meanwhile in 1975, two New Zealand scientists reported that while the Northern Hemisphere had been cooling over the past thirty years, their own region, and probably other parts of the Southern Hemisphere, had been warming.(29) There were too few weather stations in the vast unvisited southern oceans to be certain, but other studies tended to confirm it. The cooling since around 1940 had been observed mainly in northern latitudes. Perhaps cooling from industrial haze counteracted the greenhouse warming there? After all, the Northern Hemisphere was home to most of the world's industry. It was also home to most of the world's population, and as usual, people had been most impressed by the weather where they lived.(30*) |
|
| If there had almost been a consensus in the early 1970s that the entire world was cooling, the consensus now broke down. Science journalists reported that climate scientists were openly divided, and those who expected warming were increasingly numerous. In an attempt to force scientists to agree on a useful answer, in 1977 the U.S. Department of Defense persuaded two dozen of the world's top climate experts to respond to a complicated survey. Their main conclusion was that scientific knowledge was meager and all predictions were unreliable. The panel was nearly equally divided among three opinions: some thought further cooling was likely, others suspected that moderate greenhouse warming would begin fairly soon, and most of the rest expected the climate would stay about the same at least for the next couple of decades. Only a few thought it probable that there would be considerable global warming by the year 2000 (which was what would in fact happen).(31) |
|
| Government officials and scientists needed more definite statements on what was happening to the weather. Thousands of stations around the world were turning out daily numbers, but these represented many different standards and degrees of reliability — a disorderly, almost indigestible mess. Around 1980 two groups undertook to work through the numbers in all their grubby details, rejecting sets of uncertain data and tidying up the rest. | |
| One group was in New York, funded by NASA and led by James Hansen. They understood that the work by Mitchell and others mainly described the Northern Hemisphere, since that was where the great majority of reliable observations lay. Sorting through the more limited temperature observations from the other half of the world, they got reasonable averages by applying the same mathematical methods that they had used to get average numbers in their computer models of climate. (After all, Hansen remarked, when he studied other planets he might judge the entire planet by the single station where a probe had landed.) In 1981, the group reported that "the common misconception that the world is cooling is based on Northern Hemisphere experience to 1970." Just around the time that meteorologists had noticed the cooling trend, such as it was, it had apparently reversed. From a low point in the mid 1960s, by 1980 the world had warmed some 0.2°C.(32) | |
| Hansen's group looked into the causes of the fluctuations, and they got a rather good match for the temperature record using volcanic eruptions plus solar variations. Greenhouse warming by CO2 had not been a major factor (at least, not yet). More sophisticated analyses in the 1990s would eventually confirm these findings. From the 1940s to the early 1960s, the Northern Hemisphere had indeed cooled while temperatures had held roughly steady in the south. This was largely because of normal variations in natural forces, perhaps including changes in the Sun’s output, although industrial aerosol pollution had helped. Then the warming had resumed in both hemispheres. |
|
| The temporary northern cooling had been bad luck for climate science. By feeding skepticism about the greenhouse effect, while provoking some scientists and many journalists to speculate publicly about the coming of a new ice age, the cool spell gave the field a reputation for fecklessness that it would not soon live down. | =>Public opinion |
| Any greenhouse warming had been masked by chance fluctuations in solar activity, by pulses of volcanic aerosols, and by increased haze from pollution. Furthermore, as a few scientists pointed out, the upper layer of the oceans must have been absorbing heat. These effects could only delay atmospheric warming by a few decades. Hansen's group boldly predicted that considering how fast CO2 was accumulating, by the end of the 20th century "carbon dioxide warming should emerge from the noise level of natural climatic variability." Around the same time, a few other scientists using different calculations came to the same conclusion — the warming would show itself clearly sometime around 2000.(33*) |
=>Government |
| The second important group analyzing global temperatures was the British government's Climatic Research Unit at the University of East Anglia, led by Tom Wigley and Phil Jones. Help in assembling data and funding came from American scientists and agencies. The British results agreed overall with the NASA group's findings — the world was getting warmer. In 1982, East Anglia confirmed that the cooling that began in the 1940s had turned around by the early 1970s. 1981 was the warmest year in a record that stretched back a century.(34*) Returning to old records, in 1986 the group produced the first truly solid and comprehensive global analysis of average surface temperatures (including the vast ocean regions, which most earlier studies had neglected). They found considerable warming from the late 19th century up to 1940, followed by some regional cooling in the Northern Hemisphere but roughly level conditions overall to the mid-1970s. Then the warming had resumed with a vengeance. The warmest three years in the entire 134-year record had all occurred in the 1980s.(35) Convincing confirmation came from Hansen and a collaborator, who analyzed old records using quite different methods from the British, and came up with substantially the same results. It was true: an unprecedented warming was underway, at least 0.5°C in the past century.(36) |
=>International |
| In such publications, the few pages of text and numbers were the visible tip of a prodigious unseen volume of work. Many thousands of people in many countries had spent most of their working lives measuring the weather. Thousands more had devoted themselves to organizing and administering the programs, improving the instruments, standardizing the data, and maintaining the records in archives. In geophysics not much came easily. One simple sentence (like "last year was the warmest year on record") might be the distillation of the labors of a multi-generational global community. And it still had to be interpreted. |
|
| Most experts saw no solid proof that continued warming lay in the future. After all, reliable records covered barely a century and showed large fluctuations (especially the 1940-1970 dip). Couldn't the current trend be just another temporary wobble? Stephen Schneider, one of the scientists least shy about warning of climate dangers, acknowledged that "a greenhouse signal cannot yet be said to be unambiguously detected in the record." Like Hansen and some other scientists, he expected that the signal would emerge clearly around the end of the century, but not earlier.(37) |
Global average temperatures
1860-2002 (difference from 1961-1990 normals, °C),
using air measurements at land stations and sea surface temperatures measured
by ships and buoys.
From the Hadley
Centre, U.K. © Crown copyright 2003, see the site for updated
data
| After 1988 | =>after88 |
| A new major effort to track global temperature trends, joining the work by groups in New York and East Anglia, was getting underway at NOAA's National Climatic Data Center in Asheville, North Carolina. The Center had been established in 1951 as the National Weather Records Center, with the task of organizing the data that the Weather Bureau and military services had accumulated since the 1940s. The staff had assembled the world's largest collection of historical weather records. A team led by Thomas Karl tediously reviewed the statistics for the world and especially the United States. | |
| Each of the three groups began to issue annual updates, which the press reported prominently. When all the figures were in for 1988, the year proved to be a record-breaker (now the 1980s included the four warmest years since global measurements began). But in the early 1990s, average global temperatures dipped. Most experts figured the cause was the huge 1991 Pinatubo volcanic eruption, whose emissions dimmed sunlight around the world. After rains washed out the volcanic aerosols, the temperature rise resumed. 1995 was the warmest year on record, but that was topped by 1997, and 1998 beat that in turn by a surprisingly large margin. Of course these were global averages of trends that varied from one region to another. The citizens of the United States, and in particular residents of the East Coast, had not felt the degree of warming that came in some other parts of the world. But for the world as a whole, for the first time most experts now agreed: a serious warming trend was underway.(38*) |
|
| This consensus was sharply attacked by a few scientists. Some pulled out the old argument that the advance of urbanization was biasing temperature readings. In fact, around 1990 meticulous re-analysis of old records had squeezed out the urban heat-island bias to the satisfaction of all but the most stubborn critics. Moreover, long-term warming trends showed up in various kinds of physical "proxy" data measured far from cities. To be sure, in urban areas whatever global warming the greenhouse effect might be causing got a strong addition of heat, so that the combination significantly raised the mortality from heat waves. But the larger global warming trend was no statistical error.(39*) | |
| With the urbanization argument discredited, the skeptics turned to measurements by satellites that monitored the Earth. Since 1979, when the first of these satellites was launched, they had provided the first truly comprehensive set of global temperature data. The instruments did not measure temperatures on the surface, but at middle heights in the atmosphere. At these levels, analysis of the data indicated, there had been no rise of temperature, but instead a slight cooling. The satellites were designed for observing daily weather fluctuations, not the average that represented climate, and it took an extraordinarily complex analysis to get numbers that showed long-term changes. The analysis turned out to have pitfalls. Some argued against the greenhouse skeptics that the satellite data might even show a little warming.(40) |
|
| In an attempt to settle the controversy, a panel of the National Academy of Sciences conducted a full-scale review in 1999. The panel concluded that the satellites seemed reliable (balloon measurements, although far less comprehensive, also failed to find warming in mid-atmosphere). The satellite instruments simply were not designed to see the warming that was indeed taking place at the surface. The fact that the satellite measurements indicated that middle layers of the atmosphere had not noticeably warmed was embarrassing to the scientists who were constructing computer models of climate, for their models predicted significant warming there. They suspected the discrepancy could be explained by temporary effects — volcanic eruptions such as Pinatubo, or perhaps the chemical pollution that was depleting the ozone layer. The skeptics persisted. But most scientists concluded that while the computer models were surely imperfect, the satellite data analysis was too ambiguous to pose a serious challenge to the global warming consensus. (This hunch was confirmed in 2004 when a new analysis of the data showed that the mid levels had in fact been warming much as predicted. "This is the answer — I wish we had recognized it ourselves," said the chair of the 1999 Academy survey. Richard Kerr, the veteran climate reporter for Science magazine, declared that "satellite temperatures can no longer be used to portray a feeble greenhouse effect.")(41*) |
|
| By the late 1990s, many types of evidence showed a general warming at ground level. For example, the Northern Hemisphere spring was coming on average a week earlier than in the 1970s. This was confirmed by such diverse measures as earlier dates for bud-break in European botanical gardens, and a decline of Northern Hemisphere snow cover in the spring as measured in satellite pictures. Turning to a more fundamental indicator, the temperature of the upper layer of the oceans — where nearly all the heat entering the climate system was stored — again a serious rise was found in recent decades, and the greenhouse effect was the only plausible cause.(42*) (Link from below) The 1990s were unquestionably the warmest decade since thermometers came into common use, and the trend was accelerating. (We see this ourselves, who have lived long enough. My home happens to be near where I grew up five decades ago in New York State. While it’s easy to fool yourself on such matters, my personal impressions agree with the statistics on the Northeast that report a long-term trend of less snowfall, an earlier spring and higher temperatures in general. And I have stood on a Canadian glacier that was visibly in retreat.) |
|
| Most people now took it for granted that the cause was greenhouse warming, but critics pointed out that other things might be responsible. After all, the greenhouse effect could not have been responsible for much of the warming that had come between the 1890s and 1940, when industrial emissions had still been modest. So announcements that a given year was the warmest on record, when the record had started during the 19th-century cold spell, might not mean as much as people supposed. The warming up to 1940 (and the dip that followed until the 1970s) might have been caused by long-term cycles in ocean currents, or by variations in the Sun’s radiation. There were also decades-long fluctuations in the atmosphere-ocean system and in the global pattern of winds, which drove gradual variations in regional weather patterns. These had been suspected since the 1920s, but only started to become clear in the late 1990s. Until these possibilities were sorted out, the cause of the ground-level warming since 1970 would remain controversial. |
|
| However, "fingerprints" were found that pointed directly to greenhouse warming. One measure was the difference of temperature between night and day. Tyndall had pointed out more than a century back that basic physics declared that the greenhouse effect would act most effectively at night, as the gases impeded radiation from escaping into space. Statistics did show that it was especially at night that the world was warmer. No less convincing, Arrhenius at the turn of the century, and everyone since, had calculated that the Arctic would warm more than other parts of the globe. That was largely because less snow and ice would reflect less sunlight back into space. (This effect would not be expected in Antarctica, with its colossal year-round ice cover, and in fact warming was not seen there — except around the coasts and on the long peninsula that projected beyond the ice sheet). Arctic warming was glaringly obvious to scientists as they watched trees take over mountain meadows in Sweden and the Arctic Ocean's ice pack grow ever thinner. Alaskans and Siberians didn't need statistics to tell them the weather was changing when they saw buildings sag as the permafrost that supported them melted. |
|
| Pursuing this in a more sophisticated way, computer models predicted that greenhouse gases would cause a particular pattern of temperature change. It was different from what might be caused by other external influences, such as solar variations. The observed geographical pattern of change did in fact bear a rough resemblance to the computers' greenhouse effect maps. "It is likely that this trend is partially due to human activities," researchers concluded, "although many uncertainties remain."(43) Even before it was published, the finding impressed the community of climate scientists. In an important 1995 report, the world’s leading experts offered the “fingerprint” as evidence that greenhouse warming was truly underway. The leader of the team at Lawrence Livermore Lab that found the “fingerprint,” Benjamin Santer, helped write the summary of this report, and he was deeply hurt when a few skeptics attacked not only the statement but his personal scientific integrity. |
|
| The skeptics, including a minority of climate experts, continued to doubt that humans were causing global warming. Santer’s model, like all models, admittedly relied on a lot of guesswork. Or perhaps subtle changes involving the Sun (detectable only with sophisticated instruments), or something else, had somehow triggered changes in cloud cover or the like to mimic the strong night-time and Arctic warming and other features of the greenhouse fingerprint? Yet even if that were true, it just went to show how sensitive the climate must be to delicate shifts in the forces at work in the atmosphere. | <=Solar variation |
| A variety of new evidence suggested that the recent warming was exceptional even if one looked back many centuries. Beginning in the 1960s, a few historians and meteorologists had labored to discover variations of climate by digging through historical records of events like freezes and storms. For example, had the disastrous harvest of 1788 helped spark the French Revolution?Scholars found it difficult to derive an accurate picture, let alone quantitative data, from old manuscripts. Increasingly laborious projects hacked away at the problem (as one of many examples, by 2004 an international team had analyzed hundreds of thousands of weather observations recorded in 18th and 19th century ships' logs). Another kind of data came from physical analysis of tree rings, coral reefs, and other ingenious proxy measures, which produced increasingly reliable numbers.(44) | |
| One important example was a uniquely straightforward method, the measurement of old temperatures directly in boreholes. Data from various locations in Alaska, published in 1986, showed that the top 100 meters of permafrost was anomalously warm compared with deeper layers. The only possible cause was a rise of average air temperature by a few degrees since the last century, with the heat gradually seeping down into the earth.(45) In a burst of enthusiasm during the 1990s, scientists took the temperature of hundreds of deep boreholes in rock layers around the planet. The averages gave a clear signal of a recent rise in northern regions. A still more important example of the far-flung efforts was a series of heroic expeditions that labored high into the thin air of the Andes and even Tibet, hauling drill rigs onto tropical ice caps. The hard-won data showed again that the warming in the last few decades was greater than anything seen for thousands of years before. The ice caps themselves, which had endured since the last ice age, were melting away faster than the scientists could measure them.(46) |
|
| By 2005 glaciologists had gathered
enough evidence to demonstrate that most of the world's glaciers were
in retreat.(47) Glaciers that had existed since
the last ice age were melting back, revealing mummies that had been
frozen for thousands of years. The changes in the Alps, in Glacier
National Park in the United States, and on Mount Kilimanjaro made
a particularly strong impression on the public. Scientists were more
impressed by surveys showing that tropical glaciers had not been so
warm for thousands of years.
Three scientists, combining a variety of measures, put estimated Northern Hemisphere temperatures over the past ten centuries into a graph that showed a sharp turn upward since the start of the industrial revolution. The temperatures of the 1990s soared off the chart. Apparently 1998 had been not just the warmest year of the century, but of the millennium. The graph (shown below) was widely reprinted and made a strong impression. It was dubbed the "hockey stick."(48*) (For more on global temperatures before the 19th century, see the essay on solar influences.) Attempts to reconstruct temperatures before the late nineteenth century remained controversial, but the warming since then was now as certain a fact as anything in science. A few skeptics continued to play with weather and satellite statistics, but geophysicists noted that the real buildup of heat energy was easily seen, less in the thin and variable atmosphere than in the masses of solid earth sampled by boreholes. Still more telling, layers in ocean basins — which were gradually absorbing most of the heat energy — showed a pattern of recent warming. (See above.) The pattern precisely matched what computer modellers expected from greenhouse gas accumulation and nothing else. |
|
If you compared the upward curve of 20th-century temperatures with curves showing the predictions of various computer models which simulated the effects of the sharp rise in greenhouse gases (with adjustments for volcanic eruptions and solar variations), the match was close indeed, and now soaring in an unprecedented way. Most scientists could not believe all this was mere coincidence. An International Panel on Climate Change (IPCC) that gathered the views of the world’s community of experts finally agreed, with little dissent, that it was highly likely that the strong global warming since the 1970s was in large part the work of humanity.(49) As of this writing, the warmest year in a record going back to 1861 was still 1998. (In retrospect it was seen that in 1998 a "super El Niño" event, the strongest of the century, had pumped some heat from the Pacific Ocean into the atmosphere.) The year 2005 tied 1998. The next four warmest on record were 2002, 2003, 2001 and 2004. |
=>International |

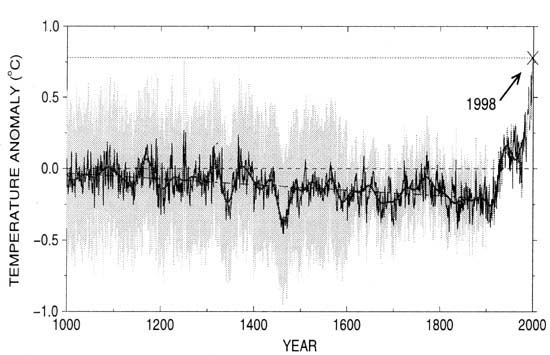
An influential 1999 reconstruction of temperatures for the past millenium,
averaged over the Northern Hemisphere, included measured temperatures for the past century. The dark solid line shows temperatures averaged over each half-century or so, and the shaded area gives the range of possible averages. An apparent downward trend from a warmer Middle Ages ("Medieval Warm Period," roughly comparable to the 1950s) into a cooler "Little Ice Age" is abruptly interrupted by a steep rise in the 20th century. (In retrospect, the dark line, which in some graphics was smoothed even more, caught too much attention. Steep changes might be concealed in the gray area of incomplete data, and the smoothed average curve could give a misleading impression of relative stability.)
This "hockey stick" graph, prominently featured in the IPCC's 2001 report, immediately became a powerful tool for people who were trying to raise public awareness of global warming — to the regret of some seasoned climate experts who recognized that, like all science at the point of publication, it was preliminary and uncertain. The dedicated contrarians who insisted that there was no global warming problem promptly attacked the calculations. For example, in 2003 a few scientists argued that the Medieval Warm Period had been as hot as the 20th century. But other climatologists, looking at data for the entire world, found a scattering of warm and cold periods in different places at different times, not comparable to the recent general warming.
Iin 2004 other groups pointed out that the huge gaps and uncertainties in the pre-19th century data, and the methods used to average the data, could conceal changes of temperature in the past that might have been as large and abrupt as anything seen in modern times — that is, aside from the warming since the 1980s, which was truly unprecedented. A National Academy of Sciences panel reviewed all the studies and in 2006 announced that the original conclusions held: (1) the world had recently grown warmer than at any time in the last four centuries, and (2) while earlier data were much less reliable, it was "plausible" that the world was now hotter than at any time in the past millenium.
As so often in this story, no single scientific finding could bring conviction by itself, but only in conjunction with many other lines of evidence. The most worrisome result of paleotemperature studies was that global climate had probably swung substantially over the centuries. As climate scientists noted, variability in the past, presumably due to small changes in the atmosphere caused by solar and volcanic-dust variations, warned that climate must be highly sensitive to any perturbation — "So greater past climate variations imply greater future climate change." Worse, much evidence indicated that the current warming was faster than anything in the historical record. And the data neatly matched the warming that every variety of computer model, consistently since the 1970s, had been predicting would result from greenhouse gas buildup in the atmosphere. (For more on the controversy see note 48*).
More recent (2004-2005) and more complete reconstructions of global temperatures are shown in this figure.
RELATED:
Home
The Public and Climate
The Carbon Dioxide Greenhouse Effect
Changing Sun, Changing Climate
| NOTES |
1. Callendar (1961), p. 1. BACK
2. One early notice was Brooks (1922). BACK
3. Kincer (1934), p. 62; "wie bei allen anderen Klimaschwankugen": Scherhag (1937), p. 263; similarly, "no evidence" of a permanent shift: George E. McEwen of Scripps, Science Newsletter (1940). BACK
4. Callendar (1938). Early attempt: Köppen (1873) BACK
5. Landsberg (1946), pp. 297-98. BACK
6. Abarbanel and McCluskey (1950), p. 23, see New York Times, May 30, 1947 and August 7, 1952. BACK
7. Brooks (1949), p. 117. BACK
8. Willett (1949), p. 50. BACK
9. In particular, Lysgaard (1950); this was cited by several authors in Shapley (1953); see also Willett (1950); on the shift of views, see Lamb (1966), 171-72, also ix, 1-2. BACK
10. Landsberg (1958); his analysis found an average 0.8°F rise, more around the Great Lakes. Landsberg (1960). BACK
13. Lamb (1959), in Changing Climate (1966) p. 19. BACK
14. Mitchell was spurred by some Scandinavian studies showing a leveling off in the 1950s — the Arctic was usually where trends showed up first. Mitchell (1961); see also Mitchell (1963), "rhythm" p. 180; for another and similar temperature curve, computed by the Main Geophysical Observatory in Leningrad (and attributed to volcanoes), see Budyko (1969), p. 612; according to Wigley, the work of Mitchell and Budyko, together with a 1961 study by Callendar, were "the first reasonably reliable estimates of large scale average temperatures," Wigley et al. (1986), p. 278; Callendar (1961) found chiefly a temperature rise in the Arctic. One other attempt was Willett (1950). BACK
15. Mitchell (1961), pp. 249, 247. BACK
16. For the North Atlantic Oscillation, see Fagan (2000), esp. pp. 207-08. BACK
17. Lamb (1997), p. 218. BACK
18. Landsberg (1967); quote: Landsberg (1970), p. 1273; on all this, see Mitchell (1991). BACK
19. Brief reviews of observations back to the 19th century include Mitchell (1953); Landsberg (1955); Landsberg (1970). BACK
20. Budyko (1962); others such as Wilson and Matthews (1971) pp. 60, 166-68 agreed the effect could be serious. BACK
21. e.g., Dronia (1967), removing urban heat effects found no net warming since the 19th century. BACK
22. Mitchell (1953); already in 1938 Callendar adjusted for the effect, while admitting that "this is a matter which is open to controversy." Callendar (1938), p. 235. Additionally, the common practice during the 1950s of moving weather stations from downtown locations to airports, outside the "heat island," would give a spurious impression of cooling, but Mitchell and others allowed for that too in their calculations. BACK
23. Lamb (1977), pp. 709-10. BACK
24. Johnsen et al. (1970); Lamb (1977), pp. 529, 549. BACK
27. Mitchell (1972), p. 445; GARP (1975), pp. 37, 43; they cite a Manabe computer model of 1971 and Mitchell (1973). BACK
28. He also suspected the natural cycle was scheduled to reverse within decades, adding to the rise. Broecker (1975). BACK
29. Salinger and Gunn (1975). BACK
30. Damon and Kunen (1976); a brief argument on turbidity reducing high-latitude temperatures is in Bryson (1973), p. 9; see also Damon and Kunen (1978). BACK
31. National Defense University (1978); also published in Council on Environmental Quality (1980), ch. 17. BACK
32. Hansen et al. (1981), "misconception" p. 961, and Hansen, interview by Weart, Oct. and Nov. 2000, AIP. BACK
33. Specifically, they predicted the effect would rise above the two-sigma level in the 1990s. Hansen et al. (1981), "emerge" p. 957; another scientist who compared temperature trends with a combination of CO2, emissions from volcanic eruptions, and supposed solar cycles, likewise got a good match, and used the cycles to predict that greenhouse warming would swamp other influences after about 2000. Gilliland (1982); Madden and Ramanathan (1980) studied the climate "noise" in comparison with warming predicted by various computer models and concluded the effect "should be detectable anytime from the present to about the year 2000," p. 767. Already in 1956, both Gilbert Plass and Roger Revelle had expected an effect, if any existed, would be apparent by the end of the century. But the editor of Nature, no critic of greenhouse arguments, thought the effect would "become apparent only halfway through the next century" if not later, Maddox (1983). BACK
34. The news for 1981 was added in proof in mid-December. Jones et al. (1982). For funding they thank the U.S. Dept. of Energy and Office of Naval Research. On American help with data, see e-mail interview of Raymond S. Bradley by Ted Feldman, 2000, copy at AIP. BACK
35. Jones et al. (1986); a review is Wigley et al. (1986). BACK
36. Hansen and Lebedeff (1987). BACK
37. Schneider (1992), p. 26; Other examples: MacCracken and Luther (1985); Ramanathan (1988). BACK
38. There was strong U.S. warming 1976-2000, but only in the winter, not the summer warming that would have been noticeable. See IPCC (2001), p. 117; Hansen et al. (2001). BACK
39. Study of the U.S., the only place where sufficiently good records were available, showed a large urban bias which, when removed, left a mild warming from 1900 to the 1930s. Karl and Jones (1989); Jones et al. (1990); irrigation and other changes in land use also contribute, making for a large total effect, according to Kalnay and Cai (2003); another debate was over whether a reported sea-surface temperature rise in the 1980s was due to temporary distortions such as an El Niño event rather than the greenhouse effect, Reynolds et al. (1989); Robock and Strong (1989). BACK
40. Spencer and Christy (1990); Spencer and Christy (1992); Christy et al. (1997) with reply by K.E. Trenberth and J.W. Hurrell gives an idea of the technical problems of analysis; Christy et al. (1998); on Christy see Royte (2001); criticism: Wentz and Schabel (1998); Kerr (1998); for counter-arguments Singer (1999). BACK
41. National Academy of Sciences (2000); see also Santer et al. (2000); more recently, Santer et al. (2002); "claimed inconsistencies between model predictions and satellite tropospheric temperature data (and between the latter and surface data) may be an artifact of data uncertainties," suggested Santer et al. (2003). The why-didn't-I-think-of-that analysis by Fu et al. (2004) showed that the microwave wavelengths supposed to measure the mid-level troposphere had been contaminated by a contribution from the higher stratosphere, which was rapidly cooling (as predicted by models). Quotes: John Wallace, Schiermeier (2004b); Kerr (2004b), p. 806. For further on recent controversies see Stephen Schneider's site, http://stephenschneider.stanford.edu/Climate/Climate_Science/Contrarians.html#Contrarians BACK
42. Buds: Menzel and Fabian (1999); a more general biological indicator was the earlier arrival of the seasonal dip in CO2 as plants took up carbon: Keeling et al. (1996); snow and general discussion: Easterling et al. (2000); oceans: Levitus et al. (2000); oceans got some 30 times as much added heat as the atmosphere: Levitus et al. (2001), updated and improved by Levitus et al. (2005); Hansen et al. (2005) with better models and data found a particularly striking match between greenhouse effect computer model estimates and observed ocean basin warming. BACK
43. Santer et al. (1996), quote p. 39; see Stevens (1999), ch. 13. Tree rings: see Fritts (1976); coral: Weber and Woodhead (1972). BACK
44. Le Roy Ladurie (1967); Lamb (1972-77); Fagan (2000). BACK
45. Lachenbruch and Marshall (1986). BACK
46. Reviews of boreholes: Pollack and Chapman (1993); Pollack et al. (1998); Pollack and Huang (2000); review of tropical ice: Thompson et al. (1993); see Krajick (2002). BACK
48. Mann et al. (1999), p. 761, copyright © 1999 American Geophysical Union, reproduced by permission. The first serious attack published in a peer-reviewed, albeit obscure, journal (Climate Research) was Soon and Baliunas (2003). Asked to respond, Mann and other top climate experts gave strong reasons for regarding the criticism as groundless, indeed based on grossly improper statistical methods, Mann et al. (2003). The chief editor of Climate Research and four other editors resigned, saying the peer-review process had been faulty, see Monastersky (2003). The sloping dashed line in the figure, indicating slight cooling over the past millennium, did rely on data that were sparse and difficult to interpret. See Mann et al. (2004), Jones and Mann (2004). The possibility of abrupt shifts concealed in the uncertainty band was pointed out by von Storch et al. (2004), but their conclusion that the graph was faulty overall was refuted by Wahl et al. (2006). The likelihood that the smoothing process concealed large temperature shifts was asserted by Moberg et al. (2005), disputed by Mann et al. (2005), and McIntyre and McKitrick (2005). Jones and Mann argued that better data and other lines of research confirmed, at a minimum, the unprecedented nature of the modern rise. Their revised global graph over two millenia is here. "Plausible": National Research Council (2006). "Past climate variations:" Keith Briffa quoted by Fred Pearce in New Scientist, Feb. 18, 2006, p. 10. For further on recent controversies see Stephen Schneider's site, http://stephenschneider.stanford.edu/Climate/Climate_Science/Contrarians.html#Contrarians and the professionally-run blog realclimate.org. BACK
49. IPCC (2001), p. 6. BACK
copyright © 2003-2006 Spencer Weart & American Institute of Physics